PACE Web Portal
To navigate to the portal go to Performance Analytics for Computational Experiments (PACE). 10 most recent experiments are displayed by defauly on the home screen. To view more experiments, click on More Exps button at bottom of the list.
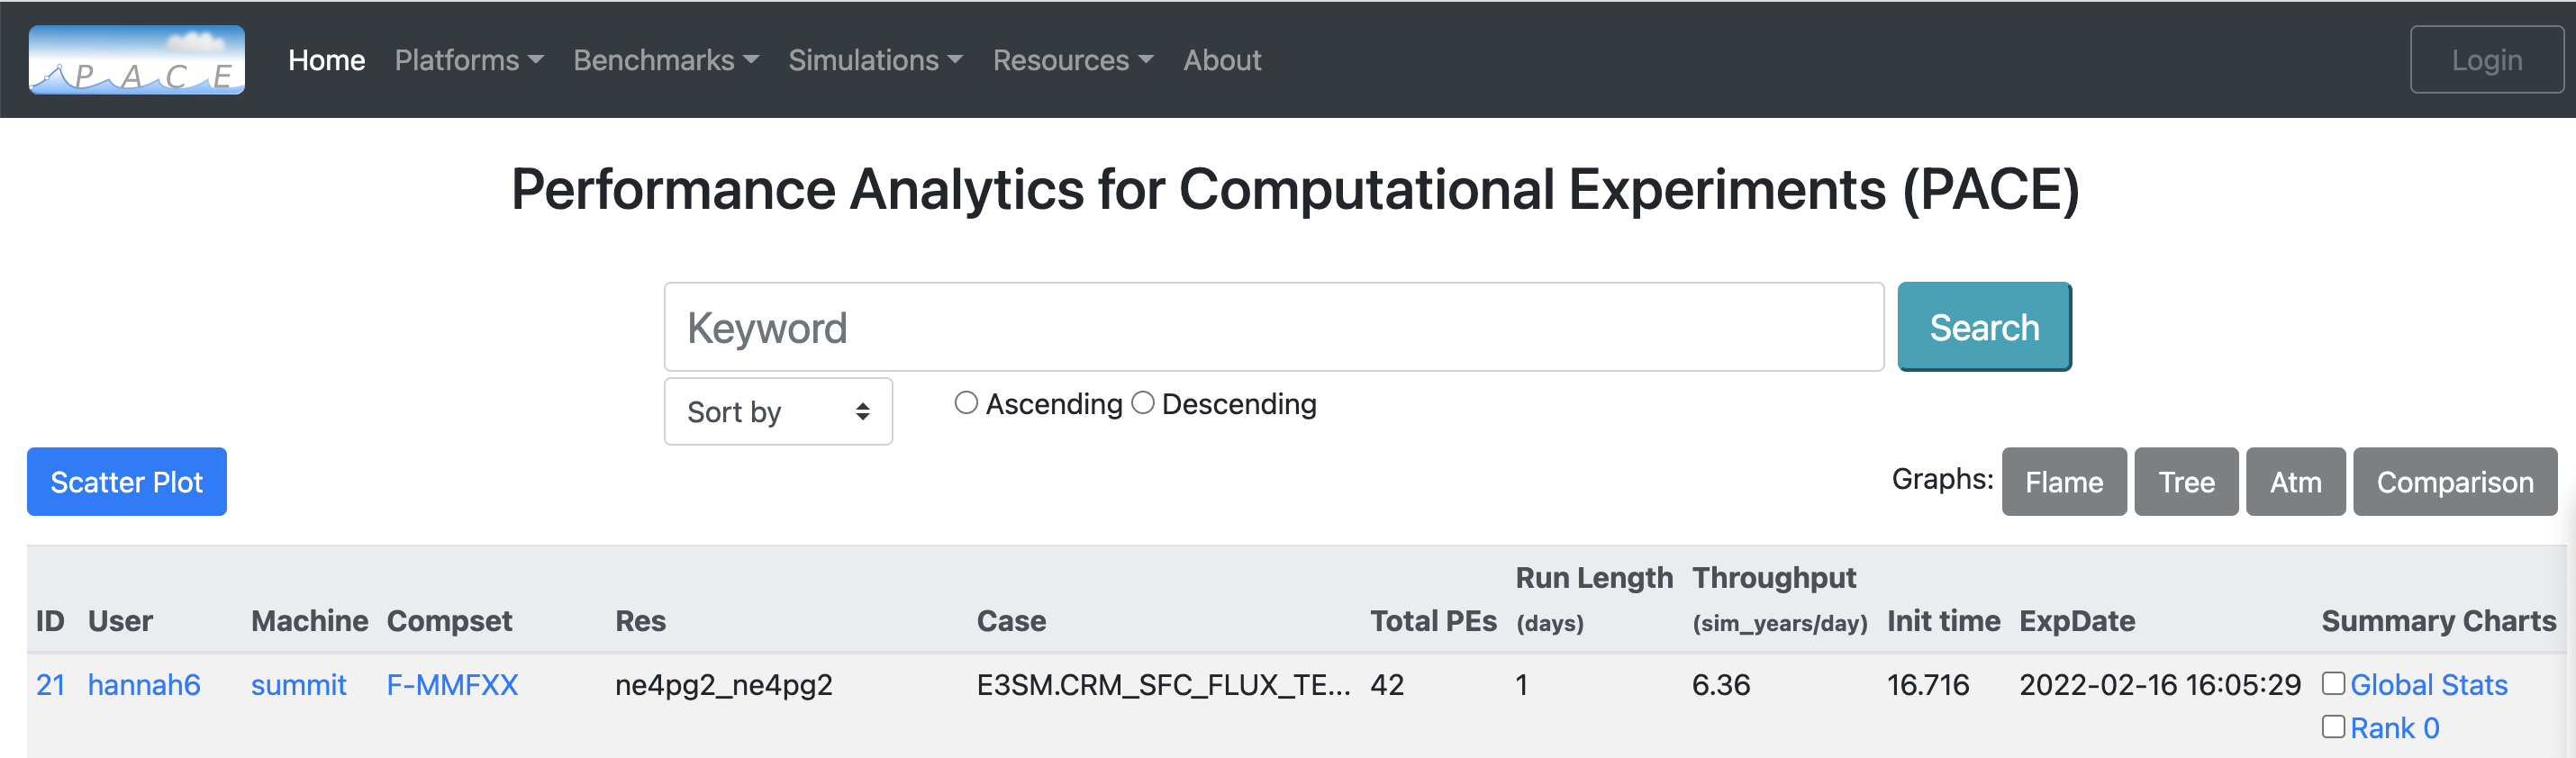
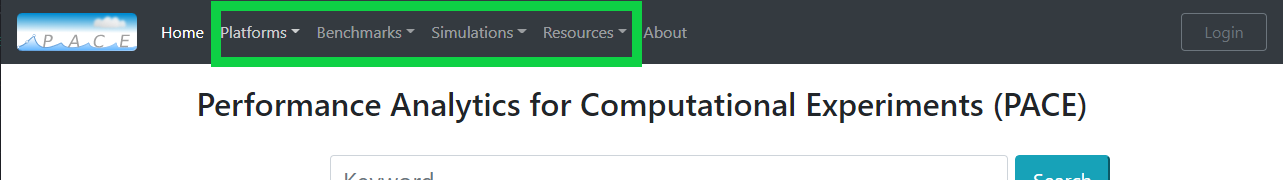
There is a high level navigation menu based on specific platforms, benchmarks, simulations etc. at the top of the page. Navigating through this will load up the 10 most recent experiments meeting the respective criteria. To view more, click on the More Exps button at bottom of the list.
An user can also search for desired set of experiments using the search functionality. The portal offers a free form search with auto complete capability. The experiments can be sorted by available options in the dropbox menu in either ascending and descending order.
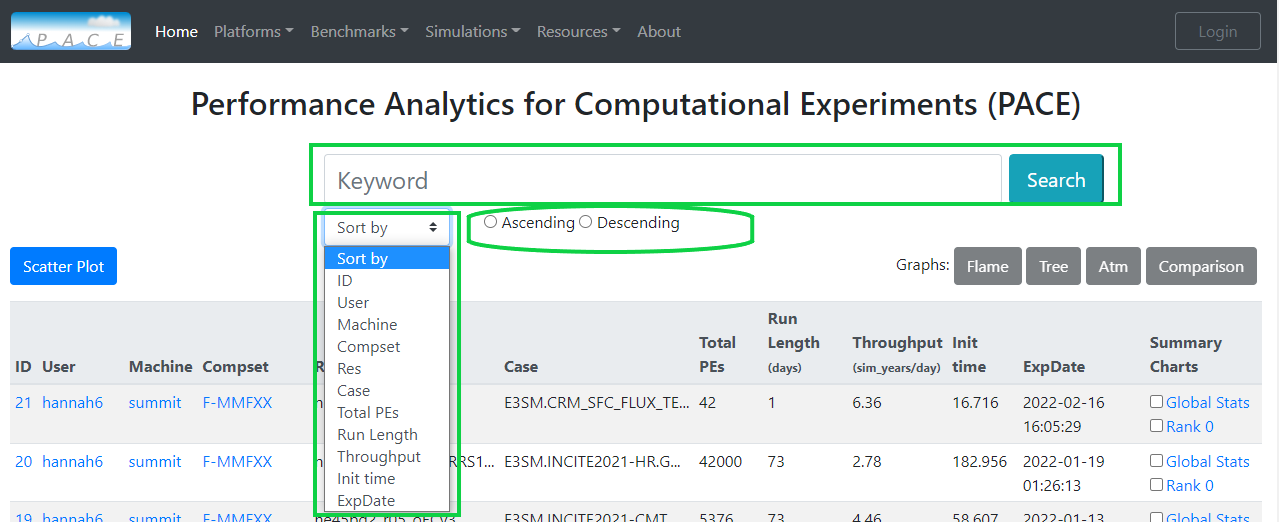
Advanced search capability is also available. For example looking for specific user and machine combination, we can do:
user:gaurab machine:summit
More than one search can also be performed at a time by using pipe (|) for search queries. For example looking for experiments by 2 different users, we can do:
user:gaurab | user:sarat
If you are looking for a exact match prepend ‘$’ keyword to your search query. More details about advanced search can be found here .
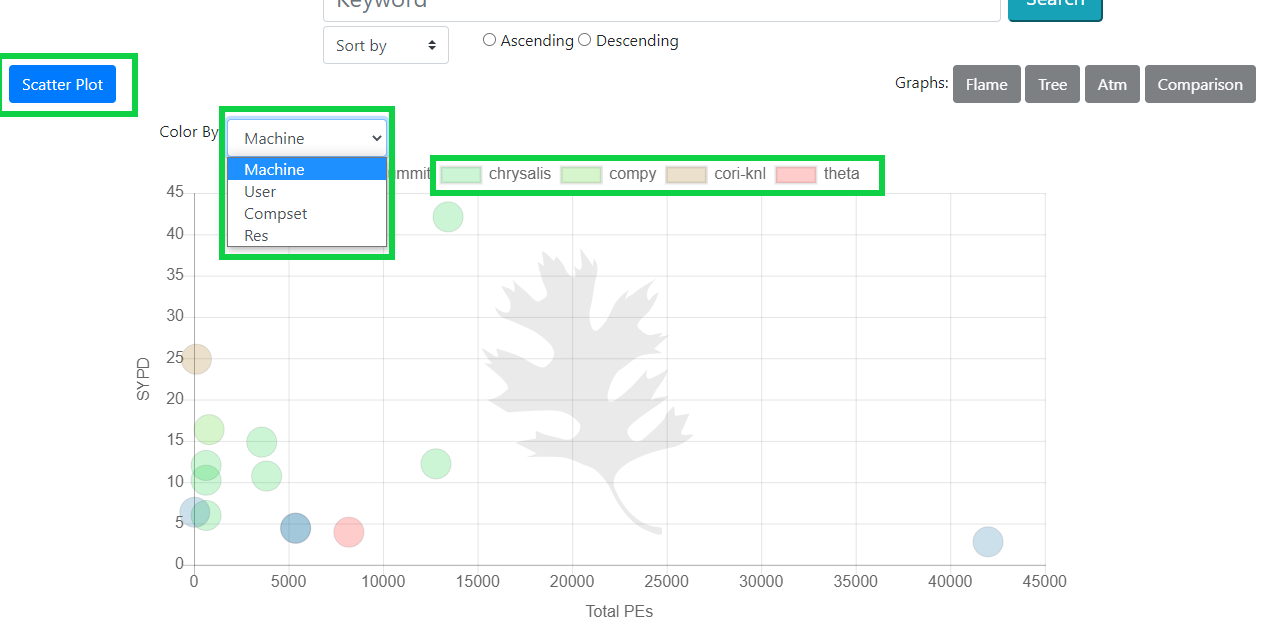
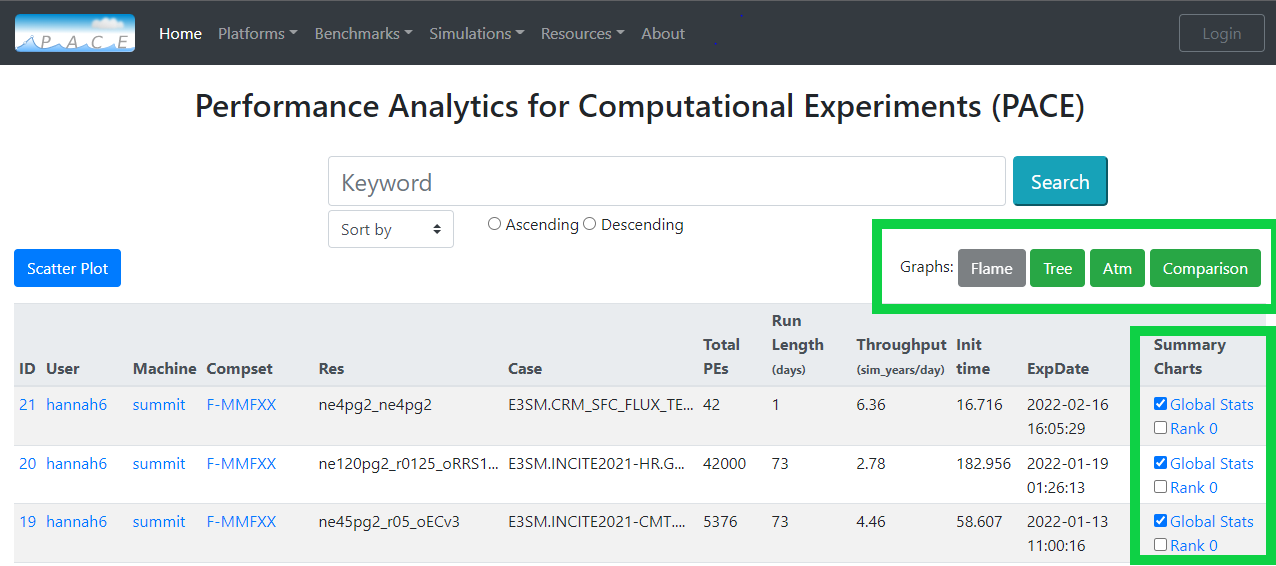
Another capability available is a summary scatter plot. Click on the ‘Scatter Plot’ button on top right. This will display a scatter graph of 50 most recent experiments matching the search criteria. The summary can be displayed for Machine, User, Compset and Res. To view for specific experiments, click on labels on top of graph which will hide/show that data point. Use labels to filter further down to your interest.
Single Experiment
To view the specific experiment, click anywhere on the experiment row. This will open up the details page for that experiment.
More details on Single experiments
Multiple Experiments
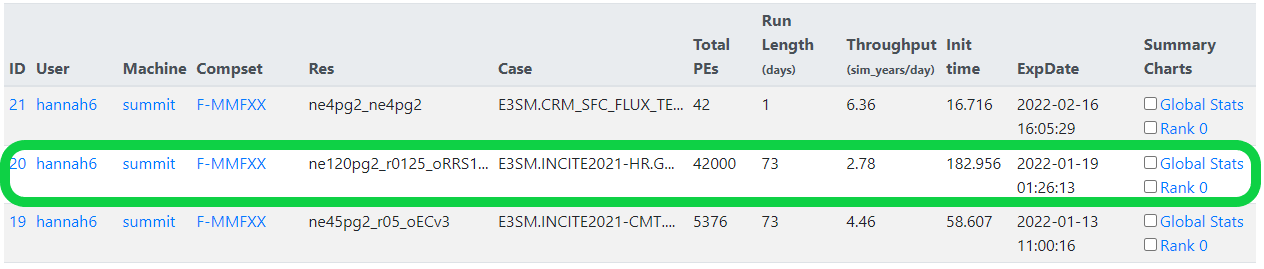
To compare multiple experiments, check boxes for your desired experiments and available graph options will light up green. This will allow for multiple experiments to be viewed simultaneously in their respective graphs.
More details on Multiple experiments